Tasmota is an alternative firmware for ESP8266 and ESP32-based devices that allows controlling and monitoring home automation equipment without relying on proprietary platforms. It offers an integrated web interface, a wide variety of compatible sensors and modules, fault tolerance, extensive automation options, and support for local integrations such as MQTT, HTTP, or Domoticz. Its philosophy focuses on privacy, flexibility, and fully local management, making it a robust option for home automation and monitoring projects.
This guide details how to install and configure a home monitoring system using MQTT, InfluxDB, Telegraf, and Grafana, together with Tasmota-based devices. The idea is to receive sensor data via MQTT, store it in InfluxDB, process it with Telegraf, and visualize it with Grafana. Each step includes the necessary commands and explanations.
Installing and Configuring MQTT
Update packages and install Mosquitto:
# apt update && apt install mosquitto -y
Then check if the service is active:
# systemctl status mosquitto
Edit the Mosquitto configuration:
# vi /etc/mosquitto/conf.d/default.conf
With the following content:
allow_anonymous false
password_file /etc/mosquitto/passwd
listener 1883
Explanation:
allow_anonymous false → disables anonymous connections.
password_file → path to the users file.
listener 1883 → port where Mosquitto will listen for connections.
Then create the DVES_USER for MQTT with a password:
# mosquitto_passwd -c /etc/mosquitto/passwd DVES_USER
Change the file ownership to the correct user:
# chown mosquitto:mosquitto /etc/mosquitto/passwd
And restart the service to apply changes:
# systemctl restart mosquitto && systemctl status mosquitto --no-pager
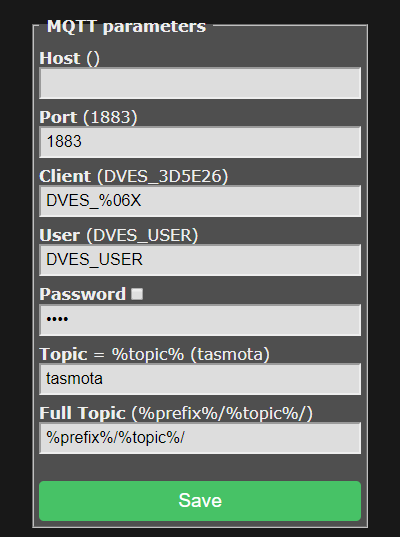
Configuration in Tasmota:
In the Tasmota WebUI, go to Configuration → Configure "Other" and enable MQTT Enabled:
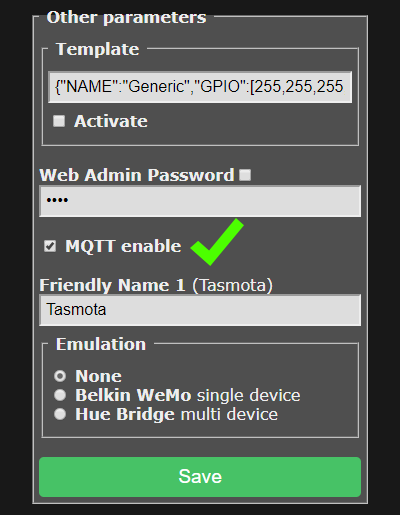
- Configure the MQTT broker with the server address and the password you created.
Verify connection from the server (replace with your password):
# mosquitto_sub -h localhost -t '#' -u 'DVES_USER' -P 'DVES_USER_PASSWORD' -v
This allows you to see all messages sent from Tasmota to MQTT.
Remember to create a firewall rule to allow TCP port 1883 from the server profile. More information is available at: How to create a firewall rule.
Installing and Configuring InfluxDB
Add the official InfluxDB repository:
# curl -s https://repos.influxdata.com/influxdata-archive.key | gpg --dearmor | tee /usr/share/keyrings/influxdata-archive-keyring.gpg > /dev/null
Its GPG key:
# echo "deb [signed-by=/usr/share/keyrings/influxdata-archive-keyring.gpg] https://repos.influxdata.com/debian bookworm stable" | tee /etc/apt/sources.list.d/influxdata.list
Install InfluxDB:
# apt install influxdb2
Enable and start the service, and check its status:
# systemctl enable influxdb && systemctl start influxdb && systemctl status influxdb --no-pager
Once the service is up, log in at http://SERVER_PUBLIC_IP:8086 to configure it and get the token for the connection. Then you can configure the InfluxDB client on the server:
# influx config create --config-name default --host-url http://localhost:8086 --token YOUR_TOKEN --org cozylife --active
The following commands allow you to list users, buckets, and organizations:
# influx user list && influx bucket list && influx org list && influx bucket find --name cozylife
Installing and Configuring Telegraf
Install Telegraf and restart Mosquitto:
# apt install telegraf -y && systemctl restart mosquitto --no-pager
Edit the Telegraf configuration file:
# vi /etc/telegraf/telegraf.conf
Example configuration for telegraf.conf (remember to replace the token, corresponding sensor, and MQTT user password):
[[outputs.influxdb_v2]]
  urls = ["http://localhost:8086"]
  token = "INFLUXDB_TOKEN"
  organization = "cozylife"
  bucket = "cozylife"

[[inputs.mqtt_consumer]]
  servers = ["tcp://localhost:1883"]
  topics = [
    "tele/cozylife_XXXXXXXXXX/SENSOR",
    "tasmota/discovery/+/sensors"
  ]
  qos = 1
  data_format = "json"
  username = "DVES_USER"
  password = "DVES_USER_PASSWORD"

[[outputs.file]]
  files = ["stdout"]
  data_format = "json"
Explanation:
- outputs.influxdb_v2: defines where to send data.
- inputs.mqtt_consumer: subscribes to MQTT topics.
- outputs.file: shows data in the terminal for debugging.
# systemctl restart telegraf.service && systemctl status telegraf.service --no-pager
Restart Telegraf and check that it works correctly.
Installing and Configuring Grafana
First, add the official stable Grafana repository:
# echo "deb [signed-by=/etc/apt/keyrings/grafana.gpg] https://apt.grafana.com stable main" | sudo tee -a /etc/apt/sources.list.d/grafana.list
And also add the repository key:
# mkdir -p /etc/apt/keyrings/ && wget -q -O - https://apt.grafana.com/gpg.key | gpg --dearmor | sudo tee /etc/apt/keyrings/grafana.gpg > /dev/null
Install the package:
# apt update && apt-get install grafana -y
Enable and start the service, and check its status:
# systemctl enable grafana-server && systemctl start grafana-server && systemctl status grafana-server --no-pager
Configuration in Grafana:
- Access the Grafana dashboard via a browser (http://SERVER_PUBLIC_IP:3000/).
- Configure InfluxDB as a Data Source using the URL, bucket, and token.
- Import dashboards or sample JSON to visualize device data.
For example, you can use the following query for the voltage graph:
from(bucket: "cozylife")
    | range(start: v.timeRangeStart, stop: v.timeRangeStop)
    | filter(fn: (r) => r._measurement == "mqtt_consumer")
    | filter(fn: (r) => r._field == "ENERGY_Voltage")
    | aggregateWindow(every: 30s, fn: median, createEmpty: false)
NGINX Configuration for Grafana (Optional)
If you want to configure Grafana over HTTPS and with a DNS record, we recommend using a reverse proxy with NGINX.
First, install NGINX and Certbot for the SSL certificate:
# apt install nginx python3-certbot-nginx -y
Then edit the default configuration file (you can create a new one if desired):
# vi /etc/nginx/sites-enabled/default
Add the following content (remember to replace server_name with your DNS record):
server {
    server_name grafana.example.com;
    location / {
        proxy_pass http://localhost:3000/;
        proxy_set_header Host $host;
        proxy_set_header X-Real-IP $remote_addr;
        proxy_set_header X-Forwarded-For $proxy_add_x_forwarded_for;
        proxy_set_header X-Forwarded-Proto $scheme;
        proxy_http_version 1.1;
        proxy_set_header Upgrade $http_upgrade;
        proxy_set_header Connection "upgrade";
    }
    listen 80;
}
Save the changes and restart NGINX:
# systemctl restart nginx.service
Finally, request the SSL certificate with Certbot:
# certbot --nginx --redirect -d grafana.example.com
Certbot will automatically configure NGINX and redirect HTTP to HTTPS.
We hope this tutorial has been helpful 🙂. Remember, if you have any questions about this or other issues related to your Clouding servers, feel free to write to soporte@clouding.io. We are here to support you with whatever you need!